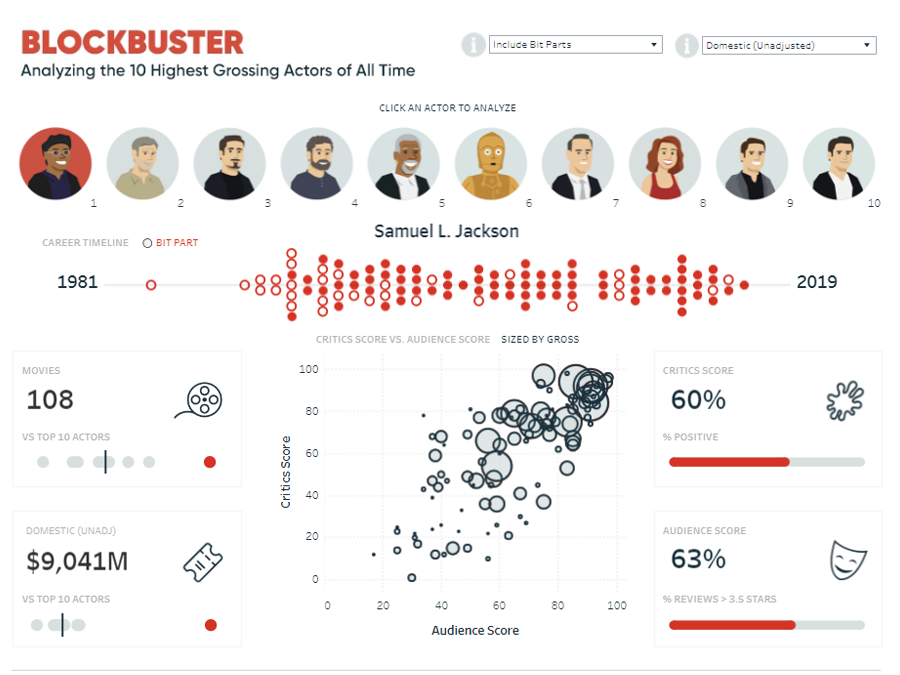
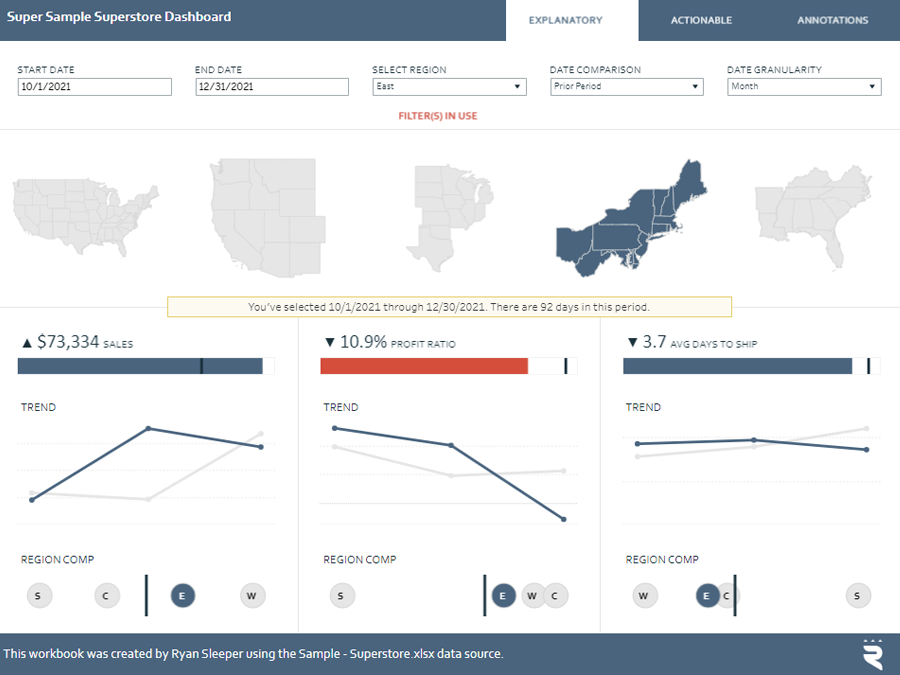
An alternative approach would be to extend the selections in the date filter so that both the current date range in question and the comparison date range are represented, but then the marks wouldn’t be lined up on the same axis. This approach would make it challenging to do direct period over period analysis because the date equivalents would not be lined up for quick comparison.
This post uses the Super Sample Superstore dashboard to provide a step-by-step tutorial for creating my go-to approach to creating date comparison filters in Tableau. This tutorial will show you how to compare a selected date range to either the date range immediately preceding the selection or the same date range one year ago. The best part about this approach is that it normalizes the selected date range and the comparison date range so that they are on the same axis for easy analysis.
How to Compare Two Date Ranges on One Axis in Tableau
Step 1 – Set up parameters for the start date and end date
The first step to comparing the performance of two date ranges on the same axis in Tableau is to set up a date parameter for the beginning of the range and a date parameter for the end of the range. These parameters will be used to select the date range instead of an out-of-the-box date filter.
To create the parameter needed for the start of the date range, right-click in any blank space in the left navigation of the authoring interface and choose “Create Parameter…”. Create a parameter with a data type of “Date” and give it a name that represents the start date. Here is how my “Minimum Date” parameter looks after setting it up and setting the date to “9/1/2016”.
Repeat this to create a parameter for the end date, leaving you with a minimum date parameter and a maximum date parameter.
Step 2 – Set up a parameter for your date range comparisons
This step is optional, but if you want the ability to toggle between the date range immediately preceding the selection and the same date range during the previous year, we will set up one additional parameter. This parameter will have a data type of “String” and will list out our options of “Prior Period” and “Prior Year”.
Step 3 – Create a calculated field that computes the number of days in the date selection
This key step counts the number of days between your start date and end date so that Tableau can eventually create an apples to apples date comparison range with the same number of days. To create a calculated field, right-click in any blank space in the left navigation of the authoring interface and choose “Create Calculated Field…”.
The formula is:
DATEDIFF(‘day’,[Minimum Date],[Maximum Date])+1
Step 4 – Create a calculated field to toggle between the two date comparison options
This is more of a half-step, but we’ll need a calculated field that tells Tableau which date comparison we are using. If it’s the date range immediately preceding the selection, Tableau will use the Days in Range calculation from the last step; if we’re comparing the selected date range to last year, we will use 365 (the number of days in a year). Here’s the formula:
CASE [Parameters].[Date Comparison]
WHEN “Prior Period” THEN [Days in Range]
WHEN “Prior Year” THEN 365
END
Step 5 – Create calculated fields to isolate the two date ranges
During this step, we will create two different Boolean calculated fields that will tell Tableau whether the date range is part of the selected date range or part of the comparison date range. The first of these two is very straightforward, and looks like this:
[Order Date 2017] >= [Minimum Date] AND [Order Date 2017] <= [Maximum Date]
Note that I’ve used a date field called “Order Date 2017” but you can plug in whatever date field you are using in your own data source.
The prior period is similar, but it subtracts the number of days in the comparison period from the previous step. Here’s the formula:
[Order Date 2017] >= [Minimum Date] – [Date Comparison]
AND [Order Date 2017] <= [Maximum Date] – [Date Comparison]
Step 6 – Create a Date Equalizer
This step is the secret sauce to getting the selected date range and comparison date range, whether it be the range immediately preceding the selection or the prior year, on the same axis.
Create a calculated field with this formula:
IF [Date Filter CP] = True THEN [Order Date 2017]
ELSEIF [Date Filter PP] = True THEN [Order Date 2017] + [Date Comparison]
ELSE NULL
END
Note again, I am using a date field called “Order Date 2017”, but you will plug in the date field from your own data source.
Step 7 – Create calculated fields for your current period measures and prior period measures
The final set-up step is to create a current period calculated field and prior period calculated field for each measure that you want to evaluate. Here’s one example using the Sales measure from the Sample – Superstore dataset.
Current Period Sales
SUM(IF [Date Filter CP] = True THEN [Sales] END)
Prior Period Sales
SUM(IF [Date Filter PP] = True THEN [Sales] END)
Step 8 – Create the view
Now that you have measures for the current period and prior period and everything is being calculated properly based on the set-up steps that we took, you can build the view. To do so, place the newly created “Date Equalizer” calculated field on the Columns Shelf. For this example, I will place the newly created Current Period Sales measure on the Rows Shelf, then put the newly created Prior Period Sales measure on the same axis. To allow you and your end users to change the date range and the comparison period, make sure you show the parameter controls for the Minimum Date, Maximum Date, and Date Comparison parameters. To do so, simply right-click on each one and choose “Show Parameter Control”.
Here’s how my view looks after setting the date granularity to continuous month, the date range to 9/1/2016 – 3/31/2017, and the date comparison to Prior Period.
In this view, the dark line represents sales during my selected date range 9/1/2016 – 3/31/2017, and the light line represents sales during the date range immediately preceding my selection. Since there are 212 days in my selected date range, the start date of my comparison date range is 9/1/2016 minus 212 days: 2/2/2016. The end date in my comparison date range is 3/31/2017 minus 212 days: 8/31/2016. This gives me an apples to apples comparison of the 212 days I’ve selected and the 212 days immediately preceding my selection.
If I would rather compare my selected date range to the same range the previous year, I simply toggle the date comparison parameter to Prior Year.
In this view, the dark line still represents my selected date range of 9/1/2016 – 3/31/2017, but the light line represents the same range during the previous year: 9/1/2015 – 3/31/2016.
Thanks for reading,
– Ryan